GroupBy
The following examples will use the groupby function to calculate temporal and spatial averages.
using YAXArrays, DimensionalData
using NetCDF
using Downloads
using Dates
using Statistics
Seasonal Averages from Time Series of Monthly Means
The following reproduces the example in xarray by Joe Hamman.
Where the goal is to calculate the seasonal average. And in order to do this properly, is necessary to calculate the weighted average considering that each month has a different number of days.
Download the data
url_path = "https://github.com/pydata/xarray-data/raw/master/rasm.nc"
filename = Downloads.download(url_path, "rasm.nc")
ds_o = Cube(filename)
WARNING
The following rebuild should not be necessary in the future, plus is unpractical to use for large data sets. Out of memory groupby currently is work in progress. Related to https://github.com/rafaqz/DimensionalData.jl/issues/642
axs = dims(ds_o) # get the dimensions
data = ds_o.data[:,:,:] # read the data
_FillValue = ds_o.properties["_FillValue"]
data = replace(data, _FillValue => NaN)
# create new YAXArray
ds = YAXArray(axs, data)
GroupBy: seasons
function weighted_seasons(ds) ... end
function weighted_seasons(ds)
    # calculate weights
    tempo = dims(ds, :Ti)
    month_length = YAXArray((tempo,), daysinmonth.(tempo))
    g_tempo = groupby(month_length, Ti => seasons(; start=December))
    sum_days = sum.(g_tempo, dims=:Ti)
    weights = map(./, g_tempo, sum_days)
    # unweighted seasons
    g_ds = groupby(ds, Ti => seasons(; start=December))
    mean_g = mean.(g_ds, dims=:Ti)
    mean_g = dropdims.(mean_g, dims=:Ti)
    # weighted seasons
    g_dsW = broadcast_dims.(*, weights, g_ds)
    weighted_g = sum.(g_dsW, dims = :Ti);
    weighted_g = dropdims.(weighted_g, dims=:Ti)
    # differences
    diff_g = map(.-, weighted_g, mean_g)
    seasons_g = lookup(mean_g, :Ti)
    return mean_g, weighted_g, diff_g, seasons_g
end
Now, we continue with the groupby operations as usual
julia> g_ds = groupby(ds, Ti => seasons(; start=December))╭──────────────────────────────────────────────────╮
│ 4-element DimGroupByArray{YAXArray{Float64,2},1} │
├──────────────────────────────────────────────────┴───────────────────── dims ┐
↓ Ti Categorical{Symbol} [:Dec_Jan_Feb, :Mar_Apr_May, :Jun_Jul_Aug, :Sep_Oct_Nov] Unordered
├──────────────────────────────────────────────────────────────────── metadata ┤
Dict{Symbol, Any} with 1 entry:
:groupby => :Ti=>CyclicBins(month; cycle=12, step=3, start=12)…
├────────────────────────────────────────────────────────────────── group dims ┤
↓ x, → y, ↗ Ti
└──────────────────────────────────────────────────────────────────────────────┘
:Dec_Jan_Feb 275×205×9 YAXArray
:Mar_Apr_May 275×205×9 YAXArray
:Jun_Jul_Aug 275×205×9 YAXArray
:Sep_Oct_Nov 275×205×9 YAXArrayAnd the mean per season is calculated as follows
julia> mean_g = mean.(g_ds, dims=:Ti)╭──────────────────────────────────────────────────╮
│ 4-element DimGroupByArray{YAXArray{Float64,3},1} │
├──────────────────────────────────────────────────┴───────────────────── dims ┐
↓ Ti Categorical{Symbol} [:Dec_Jan_Feb, :Mar_Apr_May, :Jun_Jul_Aug, :Sep_Oct_Nov] Unordered
├──────────────────────────────────────────────────────────────────── metadata ┤
Dict{Symbol, Any} with 1 entry:
:groupby => :Ti=>CyclicBins(month; cycle=12, step=3, start=12)…
├────────────────────────────────────────────────────────────────── group dims ┤
↓ x, → y, ↗ Ti
└──────────────────────────────────────────────────────────────────────────────┘
:Dec_Jan_Feb 275×205×1 YAXArray
:Mar_Apr_May 275×205×1 YAXArray
:Jun_Jul_Aug 275×205×1 YAXArray
:Sep_Oct_Nov 275×205×1 YAXArraydropdims
Note that now the time dimension has length one, we can use dropdims to remove it
julia> mean_g = dropdims.(mean_g, dims=:Ti)╭──────────────────────────────────────────────────╮
│ 4-element DimGroupByArray{YAXArray{Float64,2},1} │
├──────────────────────────────────────────────────┴───────────────────── dims ┐
↓ Ti Categorical{Symbol} [:Dec_Jan_Feb, :Mar_Apr_May, :Jun_Jul_Aug, :Sep_Oct_Nov] Unordered
├──────────────────────────────────────────────────────────────────── metadata ┤
Dict{Symbol, Any} with 1 entry:
:groupby => :Ti=>CyclicBins(month; cycle=12, step=3, start=12)…
├────────────────────────────────────────────────────────────────── group dims ┤
↓ x, → y
└──────────────────────────────────────────────────────────────────────────────┘
:Dec_Jan_Feb 275×205 YAXArray
:Mar_Apr_May 275×205 YAXArray
:Jun_Jul_Aug 275×205 YAXArray
:Sep_Oct_Nov 275×205 YAXArrayseasons
Due to the groupby function we will obtain new grouping names, in this case in the time dimension:
seasons_g = lookup(mean_g, :Ti)Categorical{Symbol} Unordered
wrapping: 4-element Vector{Symbol}:
:Dec_Jan_Feb
:Mar_Apr_May
:Jun_Jul_Aug
:Sep_Oct_NovNext, we will weight this grouping by days/month in each group.
GroupBy: weight
Create a YAXArray for the month length
tempo = dims(ds, :Ti)
month_length = YAXArray((tempo,), daysinmonth.(tempo))
╭──────────────────────────────╮
│ 36-element YAXArray{Int64,1} │
├──────────────────────────────┴───────────────────────────────────────── dims ┐
↓ Ti Sampled{CFTime.DateTimeNoLeap} [CFTime.DateTimeNoLeap(1980-09-16T12:00:00), …, CFTime.DateTimeNoLeap(1983-08-17T00:00:00)] ForwardOrdered Irregular Points
├──────────────────────────────────────────────────────────────────── metadata ┤
Dict{String, Any}()
├─────────────────────────────────────────────────────────────────── file size ┤
file size: 288.0 bytes
└──────────────────────────────────────────────────────────────────────────────┘Now group it by season
julia> g_tempo = groupby(month_length, Ti => seasons(; start=December))╭────────────────────────────────────────────────╮
│ 4-element DimGroupByArray{YAXArray{Int64,0},1} │
├────────────────────────────────────────────────┴─────────────────────── dims ┐
↓ Ti Categorical{Symbol} [:Dec_Jan_Feb, :Mar_Apr_May, :Jun_Jul_Aug, :Sep_Oct_Nov] Unordered
├──────────────────────────────────────────────────────────────────── metadata ┤
Dict{Symbol, Any} with 1 entry:
:groupby => :Ti=>CyclicBins(month; cycle=12, step=3, start=12)…
├────────────────────────────────────────────────────────────────── group dims ┤
↓ Ti
└──────────────────────────────────────────────────────────────────────────────┘
:Dec_Jan_Feb 9-element YAXArray
:Mar_Apr_May 9-element YAXArray
:Jun_Jul_Aug 9-element YAXArray
:Sep_Oct_Nov 9-element YAXArrayGet the number of days per season
julia> sum_days = sum.(g_tempo, dims=:Ti)╭────────────────────────────────────────────────╮
│ 4-element DimGroupByArray{YAXArray{Int64,1},1} │
├────────────────────────────────────────────────┴─────────────────────── dims ┐
↓ Ti Categorical{Symbol} [:Dec_Jan_Feb, :Mar_Apr_May, :Jun_Jul_Aug, :Sep_Oct_Nov] Unordered
├──────────────────────────────────────────────────────────────────── metadata ┤
Dict{Symbol, Any} with 1 entry:
:groupby => :Ti=>CyclicBins(month; cycle=12, step=3, start=12)…
├────────────────────────────────────────────────────────────────── group dims ┤
↓ Ti
└──────────────────────────────────────────────────────────────────────────────┘
:Dec_Jan_Feb 1-element YAXArray
:Mar_Apr_May 1-element YAXArray
:Jun_Jul_Aug 1-element YAXArray
:Sep_Oct_Nov 1-element YAXArrayweights
Weight the seasonal groups by sum_days
julia> weights = map(./, g_tempo, sum_days)╭──────────────────────────────────────────────────╮
│ 4-element DimGroupByArray{YAXArray{Float64,1},1} │
├──────────────────────────────────────────────────┴───────────────────── dims ┐
↓ Ti Categorical{Symbol} [:Dec_Jan_Feb, :Mar_Apr_May, :Jun_Jul_Aug, :Sep_Oct_Nov] Unordered
├──────────────────────────────────────────────────────────────────── metadata ┤
Dict{Symbol, Any} with 1 entry:
:groupby => :Ti=>CyclicBins(month; cycle=12, step=3, start=12)…
├────────────────────────────────────────────────────────────────── group dims ┤
↓ Ti
└──────────────────────────────────────────────────────────────────────────────┘
:Dec_Jan_Feb 9-element YAXArray
:Mar_Apr_May 9-element YAXArray
:Jun_Jul_Aug 9-element YAXArray
:Sep_Oct_Nov 9-element YAXArrayVerify that the sum per season is 1
julia> sum.(weights)╭───────────────────────────────╮
│ 4-element DimArray{Float64,1} │
├───────────────────────────────┴──────────────────────────────────────── dims ┐
↓ Ti Categorical{Symbol} [:Dec_Jan_Feb, :Mar_Apr_May, :Jun_Jul_Aug, :Sep_Oct_Nov] Unordered
├──────────────────────────────────────────────────────────────────── metadata ┤
Dict{Symbol, Any} with 1 entry:
:groupby => :Ti=>CyclicBins(month; cycle=12, step=3, start=12)…
└──────────────────────────────────────────────────────────────────────────────┘
:Dec_Jan_Feb 1.0
:Mar_Apr_May 1.0
:Jun_Jul_Aug 1.0
:Sep_Oct_Nov 1.0weighted seasons
Now, let's weight the seasons
julia> g_dsW = broadcast_dims.(*, weights, g_ds)╭──────────────────────────────────────────────────╮
│ 4-element DimGroupByArray{YAXArray{Float64,3},1} │
├──────────────────────────────────────────────────┴───────────────────── dims ┐
↓ Ti Categorical{Symbol} [:Dec_Jan_Feb, :Mar_Apr_May, :Jun_Jul_Aug, :Sep_Oct_Nov] Unordered
├──────────────────────────────────────────────────────────────────── metadata ┤
Dict{Symbol, Any} with 1 entry:
:groupby => :Ti=>CyclicBins(month; cycle=12, step=3, start=12)…
├────────────────────────────────────────────────────────────────── group dims ┤
↓ Ti, → x, ↗ y
└──────────────────────────────────────────────────────────────────────────────┘
:Dec_Jan_Feb 9×275×205 YAXArray
:Mar_Apr_May 9×275×205 YAXArray
:Jun_Jul_Aug 9×275×205 YAXArray
:Sep_Oct_Nov 9×275×205 YAXArrayapply a sum over the time dimension and drop it
julia> weighted_g = sum.(g_dsW, dims = :Ti);

julia> weighted_g = dropdims.(weighted_g, dims=:Ti)
╭──────────────────────────────────────────────────╮
│ 4-element DimGroupByArray{YAXArray{Float64,2},1} │
├──────────────────────────────────────────────────┴───────────────────── dims ┐
↓ Ti Categorical{Symbol} [:Dec_Jan_Feb, :Mar_Apr_May, :Jun_Jul_Aug, :Sep_Oct_Nov] Unordered
├──────────────────────────────────────────────────────────────────── metadata ┤
Dict{Symbol, Any} with 1 entry:
:groupby => :Ti=>CyclicBins(month; cycle=12, step=3, start=12)…
├────────────────────────────────────────────────────────────────── group dims ┤
↓ x, → y
└──────────────────────────────────────────────────────────────────────────────┘
:Dec_Jan_Feb 275×205 YAXArray
:Mar_Apr_May 275×205 YAXArray
:Jun_Jul_Aug 275×205 YAXArray
:Sep_Oct_Nov 275×205 YAXArrayCalculate the differences
julia> diff_g = map(.-, weighted_g, mean_g)╭──────────────────────────────────────────────────╮
│ 4-element DimGroupByArray{YAXArray{Float64,2},1} │
├──────────────────────────────────────────────────┴───────────────────── dims ┐
↓ Ti Categorical{Symbol} [:Dec_Jan_Feb, :Mar_Apr_May, :Jun_Jul_Aug, :Sep_Oct_Nov] Unordered
├──────────────────────────────────────────────────────────────────── metadata ┤
Dict{Symbol, Any} with 1 entry:
:groupby => :Ti=>CyclicBins(month; cycle=12, step=3, start=12)…
├────────────────────────────────────────────────────────────────── group dims ┤
↓ x, → y
└──────────────────────────────────────────────────────────────────────────────┘
:Dec_Jan_Feb 275×205 YAXArray
:Mar_Apr_May 275×205 YAXArray
:Jun_Jul_Aug 275×205 YAXArray
:Sep_Oct_Nov 275×205 YAXArrayAll the previous steps are equivalent to calling the function defined at the top:
mean_g, weighted_g, diff_g, seasons_g = weighted_seasons(ds)Once all calculations are done we can plot the results with Makie.jl as follows:
using CairoMakie
# define plot arguments/attributes
colorrange = (-30,30)
colormap = Reverse(:Spectral)
highclip = :red
lowclip = :grey15
cb_label =  ds_o.properties["long_name"]
"Surface air temperature"with_theme(theme_ggplot2()) do
hm_o, hm_d, hm_w = nothing, nothing, nothing
# the figure
fig = Figure(; size = (850,500))
axs = [Axis(fig[i,j], aspect=DataAspect()) for i in 1:3, j in 1:4]
for (j, s) in enumerate(seasons_g)
hm_o = heatmap!(axs[1,j], mean_g[Ti=At(s)]; colorrange, lowclip, highclip, colormap)
hm_w = heatmap!(axs[2,j], weighted_g[Ti=At(s)]; colorrange, lowclip, highclip, colormap)
hm_d = heatmap!(axs[3,j], diff_g[Ti=At(s)]; colorrange=(-0.1,0.1), lowclip, highclip,
colormap=:diverging_bwr_20_95_c54_n256)
end
Colorbar(fig[1:2,5], hm_o, label=cb_label)
Colorbar(fig[3,5], hm_d, label="Tair")
hidedecorations!.(axs, grid=false, ticks=false, label=false)
# some labels
[axs[1,j].title = string.(s) for (j,s) in enumerate(seasons_g)]
Label(fig[0,1:5], "Seasonal Surface Air Temperature", fontsize=18, font=:bold)
axs[1,1].ylabel = "Unweighted"
axs[2,1].ylabel = "Weighted"
axs[3,1].ylabel = "Difference"
colgap!(fig.layout, 5)
rowgap!(fig.layout, 5)
fig
end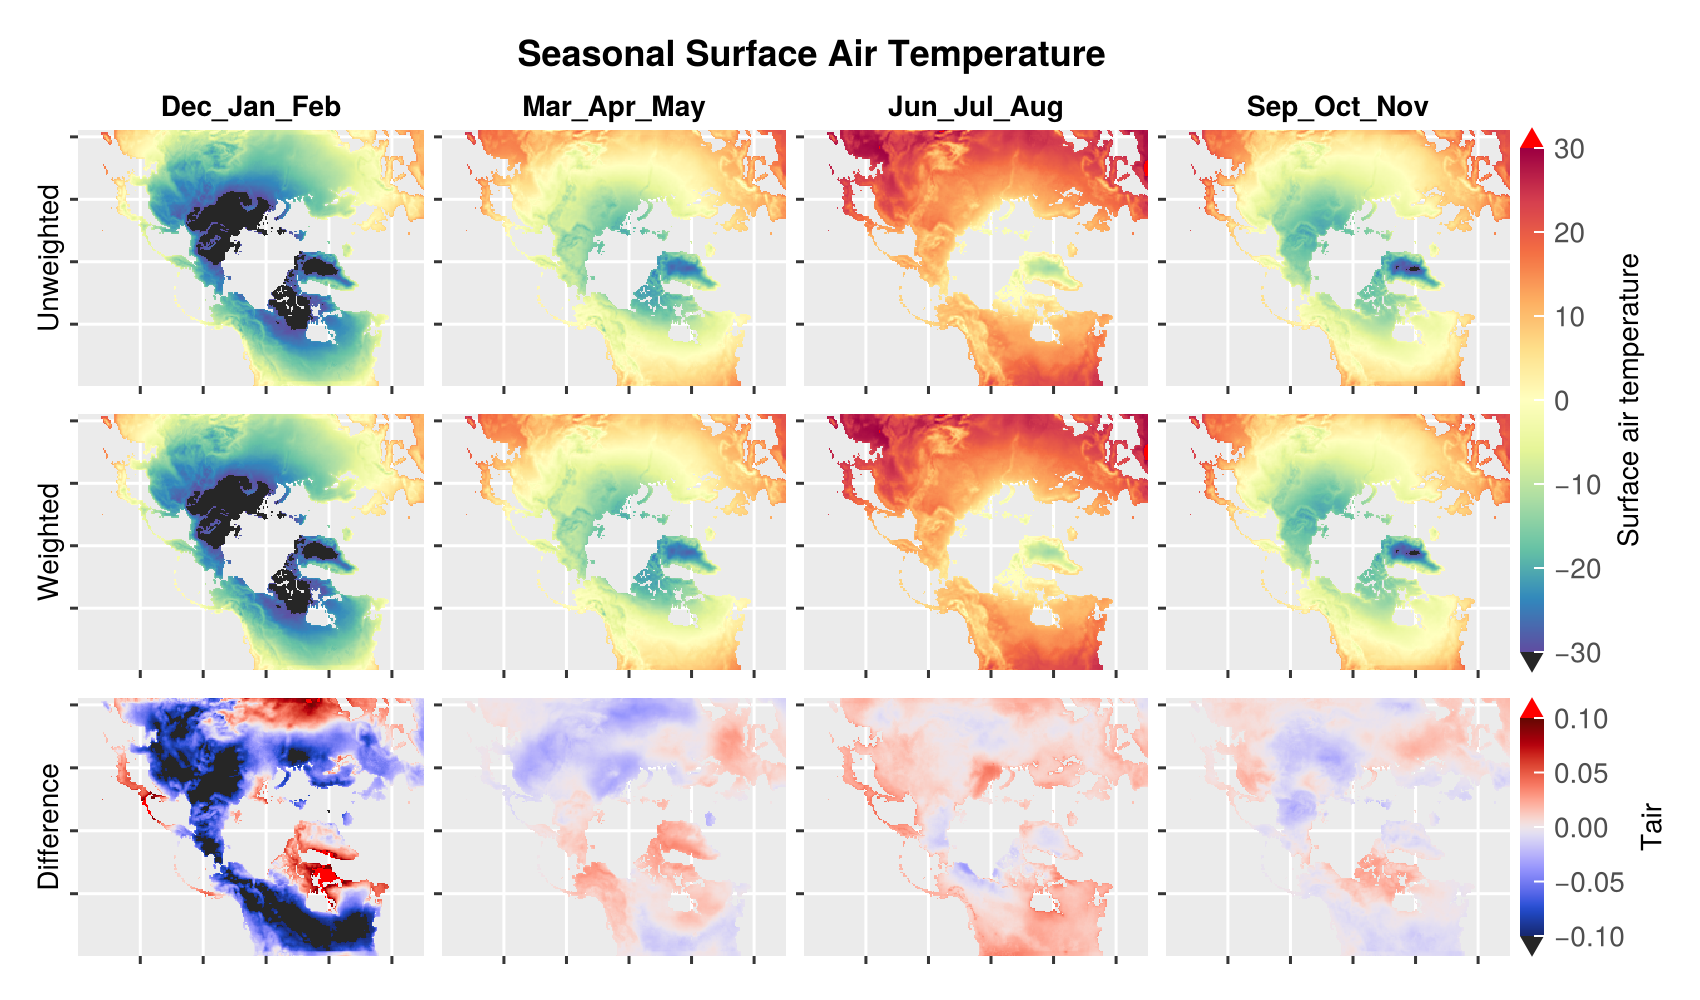
which shows a good agreement with the results first published by Joe Hamman.