Mean Seasonal Cycle for a single pixel
julia
using CairoMakie
CairoMakie.activate!()
using Dates
using Statistics
We define the data span. For simplicity, three non-leap years were selected.
julia
t =  Date("2021-01-01"):Day(1):Date("2023-12-31")
NpY = 33and create some seasonal dummy data
julia
x = repeat(range(0, 2π, length=365), NpY)
var = @. sin(x) + 0.1 * randn()
julia
fig, ax, obj = lines(t, var; color = :purple, linewidth=1.25,
    axis=(; xlabel="Time", ylabel="Variable"),
    figure = (; size = (600,400))
    )
ax.xticklabelrotation = π / 4
ax.xticklabelalign = (:right, :center)
fig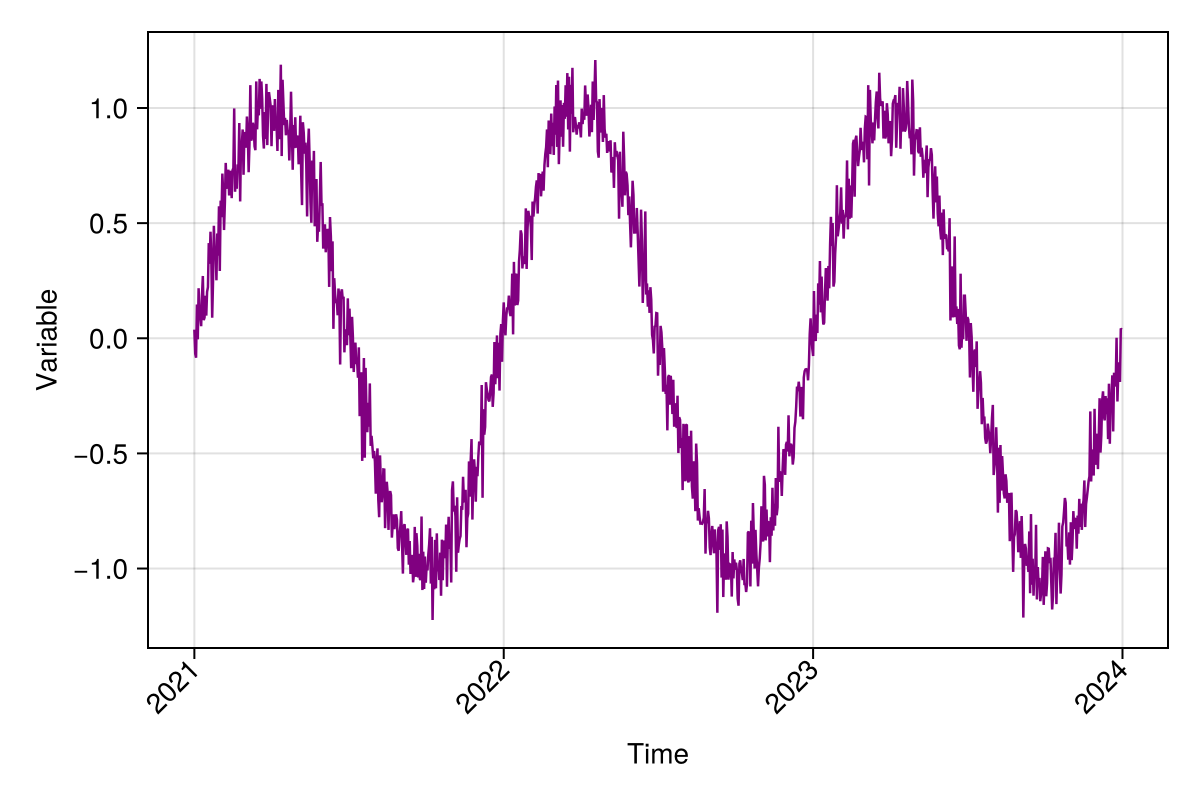
Define the cube
julia
julia> using YAXArrays, DimensionalData

julia> using YAXArrays: YAXArrays as YAX

julia> axes = (YAX.Time(t),)(↓ Time Date("2021-01-01"):Dates.Day(1):Date("2023-12-31"))julia
julia> c = YAXArray(axes, var)┌ 1095-element YAXArray{Float64, 1} ┐
├───────────────────────────────────┴──────────────────────────────────── dims ┐
↓ Time Sampled{Date} Date("2021-01-01"):Dates.Day(1):Date("2023-12-31") ForwardOrdered Regular Points
├──────────────────────────────────────────────────────────── loaded in memory ┤
data size: 8.55 KB
└──────────────────────────────────────────────────────────────────────────────┘Let's calculate the mean seasonal cycle of our dummy variable 'var'
julia
function mean_seasonal_cycle(c; ndays = 365)
    ## filterig by month-day
    monthday = map(x->Dates.format(x, "u-d"), collect(c.Time))
    datesid = unique(monthday)
    ## number of years
    NpY = Int(size(monthday,1)/ndays)
    idx = Int.(zeros(ndays, NpY))
    ## get the day-month indices for data subsetting
    for i in 1:ndays
        idx[i,:] = Int.(findall(x-> x == datesid[i], monthday))
    end
    ## compute the mean seasonal cycle
    mscarray = map(x->var[x], idx)
    msc = mapslices(mean, mscarray, dims=2)
    return msc
end

msc = mean_seasonal_cycle(c);
365×1 Matrix{Float64}:
0.03879945803136043
0.06260577651410543
-0.0219635849384688
0.0776273050145437
0.07734788438480804
0.12186204478419795
0.17931168226931812
0.118931468021226
0.16142509525832635
0.14248833931152807
⋮
-0.15270362595277617
-0.10343132724059885
-0.10354490162996693
-0.15877650883324207
-0.16451799038067652
-0.022872265818509208
-0.013690656055496556
-0.01715112462831001
0.02240115995635325TODO: Apply the new groupby funtion from DD
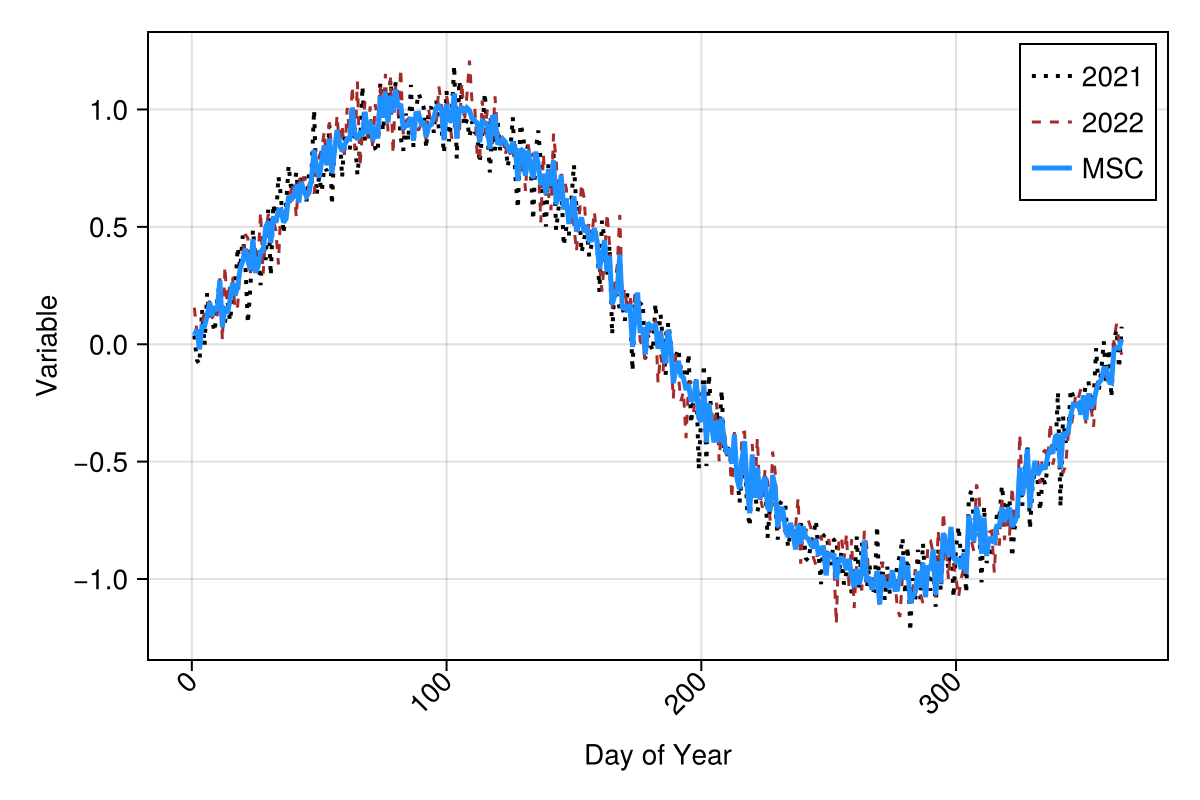
Plot results: mean seasonal cycle
julia
fig, ax, obj = lines(1:365, var[1:365]; label="2021", color=:black,
    linewidth=2.0, linestyle=:dot,
    axis = (;  xlabel="Day of Year", ylabel="Variable"),
    figure=(; size = (600,400))
    )
lines!(1:365, var[366:730], label="2022", color=:brown,
    linewidth=1.5, linestyle=:dash
    )
lines!(1:365, msc[:,1]; label="MSC", color=:dodgerblue, linewidth=2.5)
axislegend()
ax.xticklabelrotation = π / 4
ax.xticklabelalign = (:right, :center)
fig
current_figure()